Data released by Bureau of Transportation Statistics shows 85 percent of U.S. rural residents had reasonable access to intercity transportation in 2021
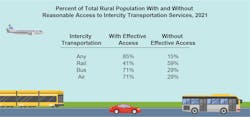
According to recent data released by the U.S. Bureau of Transportation Statistics (BTS), 85 percent of the nation’s 88.8 million rural residents had reasonable access to intercity transportation in 2021. Reasonable access, according to BTS, means residents lived within 75 miles of a large airport or within 25 miles of a smaller airport, intercity bus stop or intercity rail station with scheduled service.
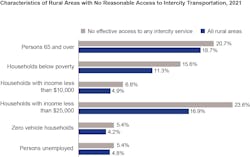
According to the BTS, excluding rural residents living on the fringe of an urban area increases the percentage of the rural population without reasonable intercity transportation access from 15 percent to 25 percent. Regions that are far away from major cities or heavily populated areas have significantly lower access to intercity transportation. Populations in rural areas without reasonable access to intercity transportation disproportionately include low-income households.
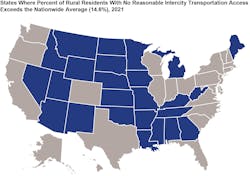
In 25 states, the percentage of rural residents without reasonable access to intercity transportation exceeded 15 percent in 2021. In 12 states, that percentage exceeded 25 percent. In South Dakota, 62 percent of rural residents lacked reasonable access to scheduled intercity transportation in 2021, which is the greatest percentage of any state.
In 2021, BTS notes households with an income of less than $25,000 accounted for 17 percent of total rural households but they accounted for a disproportionately larger share (24 percent) of the rural households lacking reasonable access to intercity transportation. The percent of the population aged 65 and over, the percent unemployed and the percent of zero-vehicle households also tends to be higher in rural areas without reasonable intercity transportation access, but the difference is less disproportional.
BTS released an interactive map application that shows the percent of the rural population with reasonable access to scheduled air (commercial), intercity bus, and/or intercity rail transportation for the years 2006, 2012, 2018, and 2021 by county. The map also shows the change in the number of intercity transportation facilities from 2006-2021 and the locations of the facilities in each year by county.


