Friction Management: Implementation and State of Good Repair
Friction management is a well-established technology in the rail transit industry. Its significance is such that it is considered one of the five pillars of wheel/rail interface management Davey Mitchell, commercial manager of Friction Modifier at L.B. Foster Rail Technologies, told delegates at the 2024 Rail Transit Wheel/Rail Interaction Conference, of which Mass Transit is the presenting sponsor. The other four pillars are:
- Wheel and rail profiles
- Rail grinding and wheel truing
- Track geometry and vehicle dynamics
- Metallurgy and welding
Friction management works in conjunction with these other pieces by improving wear rates of wheels and rail, mitigating defect growth, improving steering and train dynamics, reducing noise and effectively lowering the stress state of the entire system.
Friction management encompasses both top-of-rail (TOR) friction modifiers, as well as gage-face (GF) lubricants. GF lubrication mediates contact between the wheel flange and GF of the rail and is designed to drop the coefficient of friction as low as possible. It’s also used to treat restraining rail and back-of-wheel wheel flange, in some cases.
TOR friction modifiers are designed to constrain the coefficient of friction within a specific range (typically 0.3 to 0.4). A third type of friction modifier called traction gel is designed to raise the coefficient. These products are used on the top of rail when the surface is too slick, typically due to the accretion of compacted leaf matter during the fall months.
“You need consistent friction on the top of rail for traction and braking and you want to introduce positive friction characteristics to eliminate stick-slip oscillation,” Mitchell said.
These stick-slip oscillations are one of the common ways in which corrugation develops and propagates.
Many railroads and rail transit systems use specialized combinations of friction management consumables and wayside application devices to address specific issues at specific track locations. System-wide issues or locations without easy wayside access tend to lend themselves better to on-board delivery systems.
The proper application of a product can mitigate problems like noise and vibration, rolling contact fatigue (RCF), corrugation, excessive flange wear, broken fasteners and many others but each issue may have a different optimal solution in terms of the friction modifier product and application strategy, Mitchell noted. He recommended working with a supplier or consultant who specializes in friction management to maximize the return on investment.
Dialing-in the right FM solution for the problem and location is an involved process but the benefits of doing so are notable and well documented. Immediate benefits include:
- 25 percent to 60 percent reduction in wear
- 5 dBA to 10 dBA reduction in noise
- Three- to five-percent improvement in fuel economy
- Enhanced safety by reducing lateral-over-vertical ratios and high wheelset angle of attack associated with wheel-climb derailments.
And longer-term benefits include:
- An average ~50 percent reduction in required rail grinding interval frequency
- An ~50 percent reduction in new defect development
- A 20 percent to 80 percent reduction in fastener damage/destruction
- Improved ride quality due to improved steering characteristics and reduced corrugation and RCF
“In our experience, friction management implementation typically produces a return on investment in less than a year,” Mitchell said.
Implementation and asset management
Given the potential benefits of an optimized, well-implemented friction management program, transit agencies want to know how to realize and quantify these benefits and how systems fit into a broader framework, such as the American Public Transportation Association’s (APTA) recommended practices for asset management and maintaining a state of good repair (SGR).
The APTA Standards Committee defines the state of good repair as “a condition in which assets are fit for the purpose for which they were intended.” Mitchell said that in the case of friction management, the intended purpose is to improve asset reliability, extend asset life, reduce emissions and enhance safety. The following case studies, all referencing past APTA presentations, illustrate how relatively basic asset management planning has enabled transit properties to keep their friction management systems in a state of good repair and to reap the benefits of doing so. Each of these studies notes the purpose of the friction management program, the asset inventory, asset condition (including maintenance practices) and the asset investment plan, which includes inventory control, long-term planning and expansion of the program.
The first case study comes from a transit agency in western Canada. The impetus for implementing a friction management (FM) program was primarily to reduce noise systemwide and, secondarily, to reduce curve wear, according to Mitchell. The agency’s inventory consisted of 40 wayside GF lubricators ranging in age from new to 30-years old. In terms of maintenance, this transit agency had two workers who, in addition to other duties, visited each applicator twice a week to inspect, refill and repair the units. The agency also had a well-developed asset investment plan that included a stock of spare parts that is replenished monthly, spare applicators ready to be deployed and a plan for expanding the FM program in tandem with an upcoming new line extension.
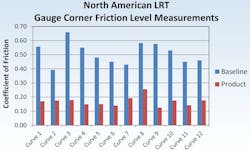
Figure 2 shows the coefficient of friction on sharp curves (greater than or equal to 4.5 degrees) on the property before and after the implementation of GF lubrication. Mitchell said the agency has been able to maintain these levels by adhering to an effective asset management plan over the years.
Another case study comes from a transit agency in the western United States. Here, too, noise complaints in curves were the primary reason for implementing friction management. However, in this case, the agency opted for a TOR friction modifier rather than GF lubrication. The inventory consisted of nine wayside TOR applicators, all of which were eight years old at the time of reporting. This agency did not perform any maintenance on the units (or keep any spare parts in inventory) except to ensure they were kept filled with product and were inspected multiple times per week.
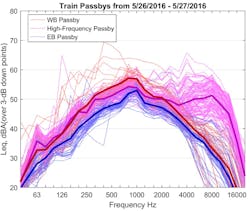
Figure 3 shows high-frequency noise events in roughly 50 percent of the agency’s trains prior to the implementation of TOR FM. Although these are primarily flanging noise signatures, the transit agency was unable to use GF lubrication due to specific safety concerns. Nonetheless, TOR FM was able to improve truck steering enough to reduce these noise events.
Figure 4 (left graph) shows high-frequency noise events in 20 percent to 45 percent of trains shortly after FM implementation. To improve this lackluster performance, the agency made adjustments to the applicator bar height and placement and product flow rate. Figure 4 (right graph) shows that after these optimizations, only five percent of trains generated high noise events.
“It’s important to remember that optimization has to be part of the asset management process if you want to get the best results,” Mitchell said.
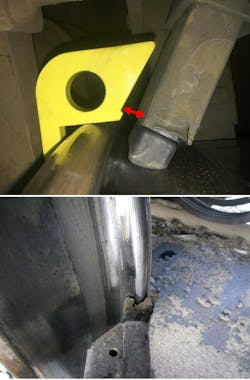
A third case study, also from a western U.S. transit agency, shows the efficacy of good asset management in conjunction with on-board friction management. For this agency, the primary motive for FM implementation was to reduce flange wear; a secondary motive was to reduce noise. The agency’s fleet consists of several vehicle types. At the time of this study, 30 percent to 60 percent of its cars (depending on type) were equipped with solid-stick friction management applicators — lubricating sticks on the wheel flange and friction modifier sticks on the wheel tread. The applicators were inspected and refilled when the vehicles were in the shop for their scheduled 10,000-mile maintenance cycle. Mitchell noted aside from keeping the applicators filled with product, alignment of the FM applicator is the primary challenge of on-board systems.
“Flange alignment can be particularly sensitive because as the wheel wears, the angle of the stick has to be adjusted to optimize coverage,” Mitchell said.
The study showed that by treating the friction management equipment like any other component of the vehicle on their maintenance checklist, the agency was able to keep the FM application system in a state of good repair.
For inventory management, the agency kept spare parts and consumables in stock with automatic inventory control and re-order triggers. Friction management was also later included in their vehicle procurement specifications, a much less costly prospect than having to retrofit vehicles after delivery, Mitchell noted.
This friction management/asset management plan has proven to be very effective for the agency. The flange wear rates after implementation fell to 0.002 mm per 1,000 km (~7 hundred-thousandths of an inch per ~621 mi) — a figure well below the predicted 0.01 to 0.02 mm per 1,000 km wear rate that is typically forecast for wheels with this friction management setup.
Another case study looked at the efforts of a transit agency in the eastern U.S. to use onboard solid-stick friction management to reduce derailment potential after experiencing 10 wheel/rail-related derailments during a two-year period. The agency equipped 33 percent of each vehicle’s wheels with solid-stick flange lubrication units. Like in the previous case study, the agency inspected and filled the applicators as part of its regular preventive car maintenance cycle and kept spare parts and consumables in inventory.
As part of the friction management plan, the agency modeled the predicted effect of flange lubrication on derailment potential. The agency models indicated that flange lubrication would increase the lateral-over-vertical load required to initiate a derailment by 74 percent — an improvement that would effectively put all its potential wheel/rail interactions below the derailment threshold, according to Mitchell. The modeling also predicted an average flange wear reduction of 40 percent to 70 percent.
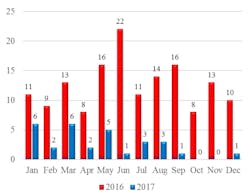
Since implementing the friction management program in 2017, the agency has not had any derailments and flange wear has been reduced. Figure 6 shows wheel replacements due to wear in the year prior to flange lubrication implementation (in red) and the year after implementation (in blue) — an 80 percent reduction.
“For a roughly $220,000 capital investment, the agency saved $1.26 million on wheel replacement and associated costs in the first year,” Mitchell said.
Taken together, these case studies show that transit properties that get the most out of their friction management programs share some basic characteristics in terms of their asset management.
They know the specific issue(s) they are addressing with their friction management programs. Through consultation and research these agencies deployed the optimal product and application method for their target and operating environment.
"It certainly helps to have a champion within the agency who is committed to the project,” Mitchell said.
They track their inventory and know what equipment they have and where it’s located.
They maintain their assets. These agencies have trained personnel who regularly perform inspections, keep applicators filled, and generally incorporate friction management into their preventive-maintenance practices.
“It’s not necessary to have [a worker] dedicated only to friction management,” Mitchell said while noting proper training and some man-hours dedicated to friction management is critical.
They have an asset investment plan that incorporates friction management into their specifications and capital planning and a program to manage an inventory of consumables and spare parts.
Following these principles, transit agencies can ensure they’re achieving the expected results and return on investment. Not every friction management program will or should look the same, of course. Some agencies choose to outsource maintenance of their equipment and/or spare parts inventory to the supplier, some incorporate remote monitoring of their equipment into their asset management plan, some collaborate with suppliers and consultants regarding investment planning.
Mitchell notes there are many ways such programs can be fine-tuned to an individual agency or property’s needs but the basic calculus is simple: A good asset management plan keeps friction management systems in a state of good repair, which, in turn, enables the system to deliver the expected return on investment.
---------
This article is based on a presentation made at the 2024 Rail Transit Wheel/Rail Interaction Conference.
About the Author

Jeff Tuzik
Jeff Tuzik is managing editor of Interface Journal. His work appears through an agreement with Wheel/Rail Seminars of which Mass Transit is the presenting sponsor.
